New nationwide study reveals dramatic pricing gaps between states, with California homeowners paying nearly double national averages
Cabana Pool Service today released its comprehensive 2025 Pool Service Pricing Guide, analyzing pricing data from over 1,000 pool service companies nationwide. The study reveals striking regional variations in pool maintenance costs, with some markets commanding premium prices that reflect broader economic pressures facing homeowners.
The data paints a picture of an industry increasingly shaped by geography, labor availability, and local demand. While national averages hover around $140 monthly for basic pool cleaning, the findings show homeowners in certain markets paying significantly more for the same services.
California Commands Premium Prices Across All Services
California emerges as the clear outlier in pool service pricing, with monthly cleaning costs averaging $195 statewide and reaching $230 in premium markets like Los Angeles County, Orange County, and the San Francisco Bay Area.
The Golden State’s pricing extends beyond routine maintenance. Pool filter cleaning, which averages $73 nationally, averages $150 in California. Hot tub cleaning services command $140 to $160 monthly, compared to $100 to $130 in other major pool markets.

These elevated costs likely reflect California’s higher labor expenses, stricter environmental regulations, and persistent drought conditions that require specialized pool chemistry management. The state’s competitive real estate market also supports premium service pricing among affluent homeowners.
Texas Presents Mixed Pricing Landscape
Texas shows the most dramatic internal variations of any state studied. While statewide averages reach $198 monthly for pool cleaning, individual markets tell vastly different stories. Austin commands $218 monthly, while El Paso homeowners pay $168 for identical services.
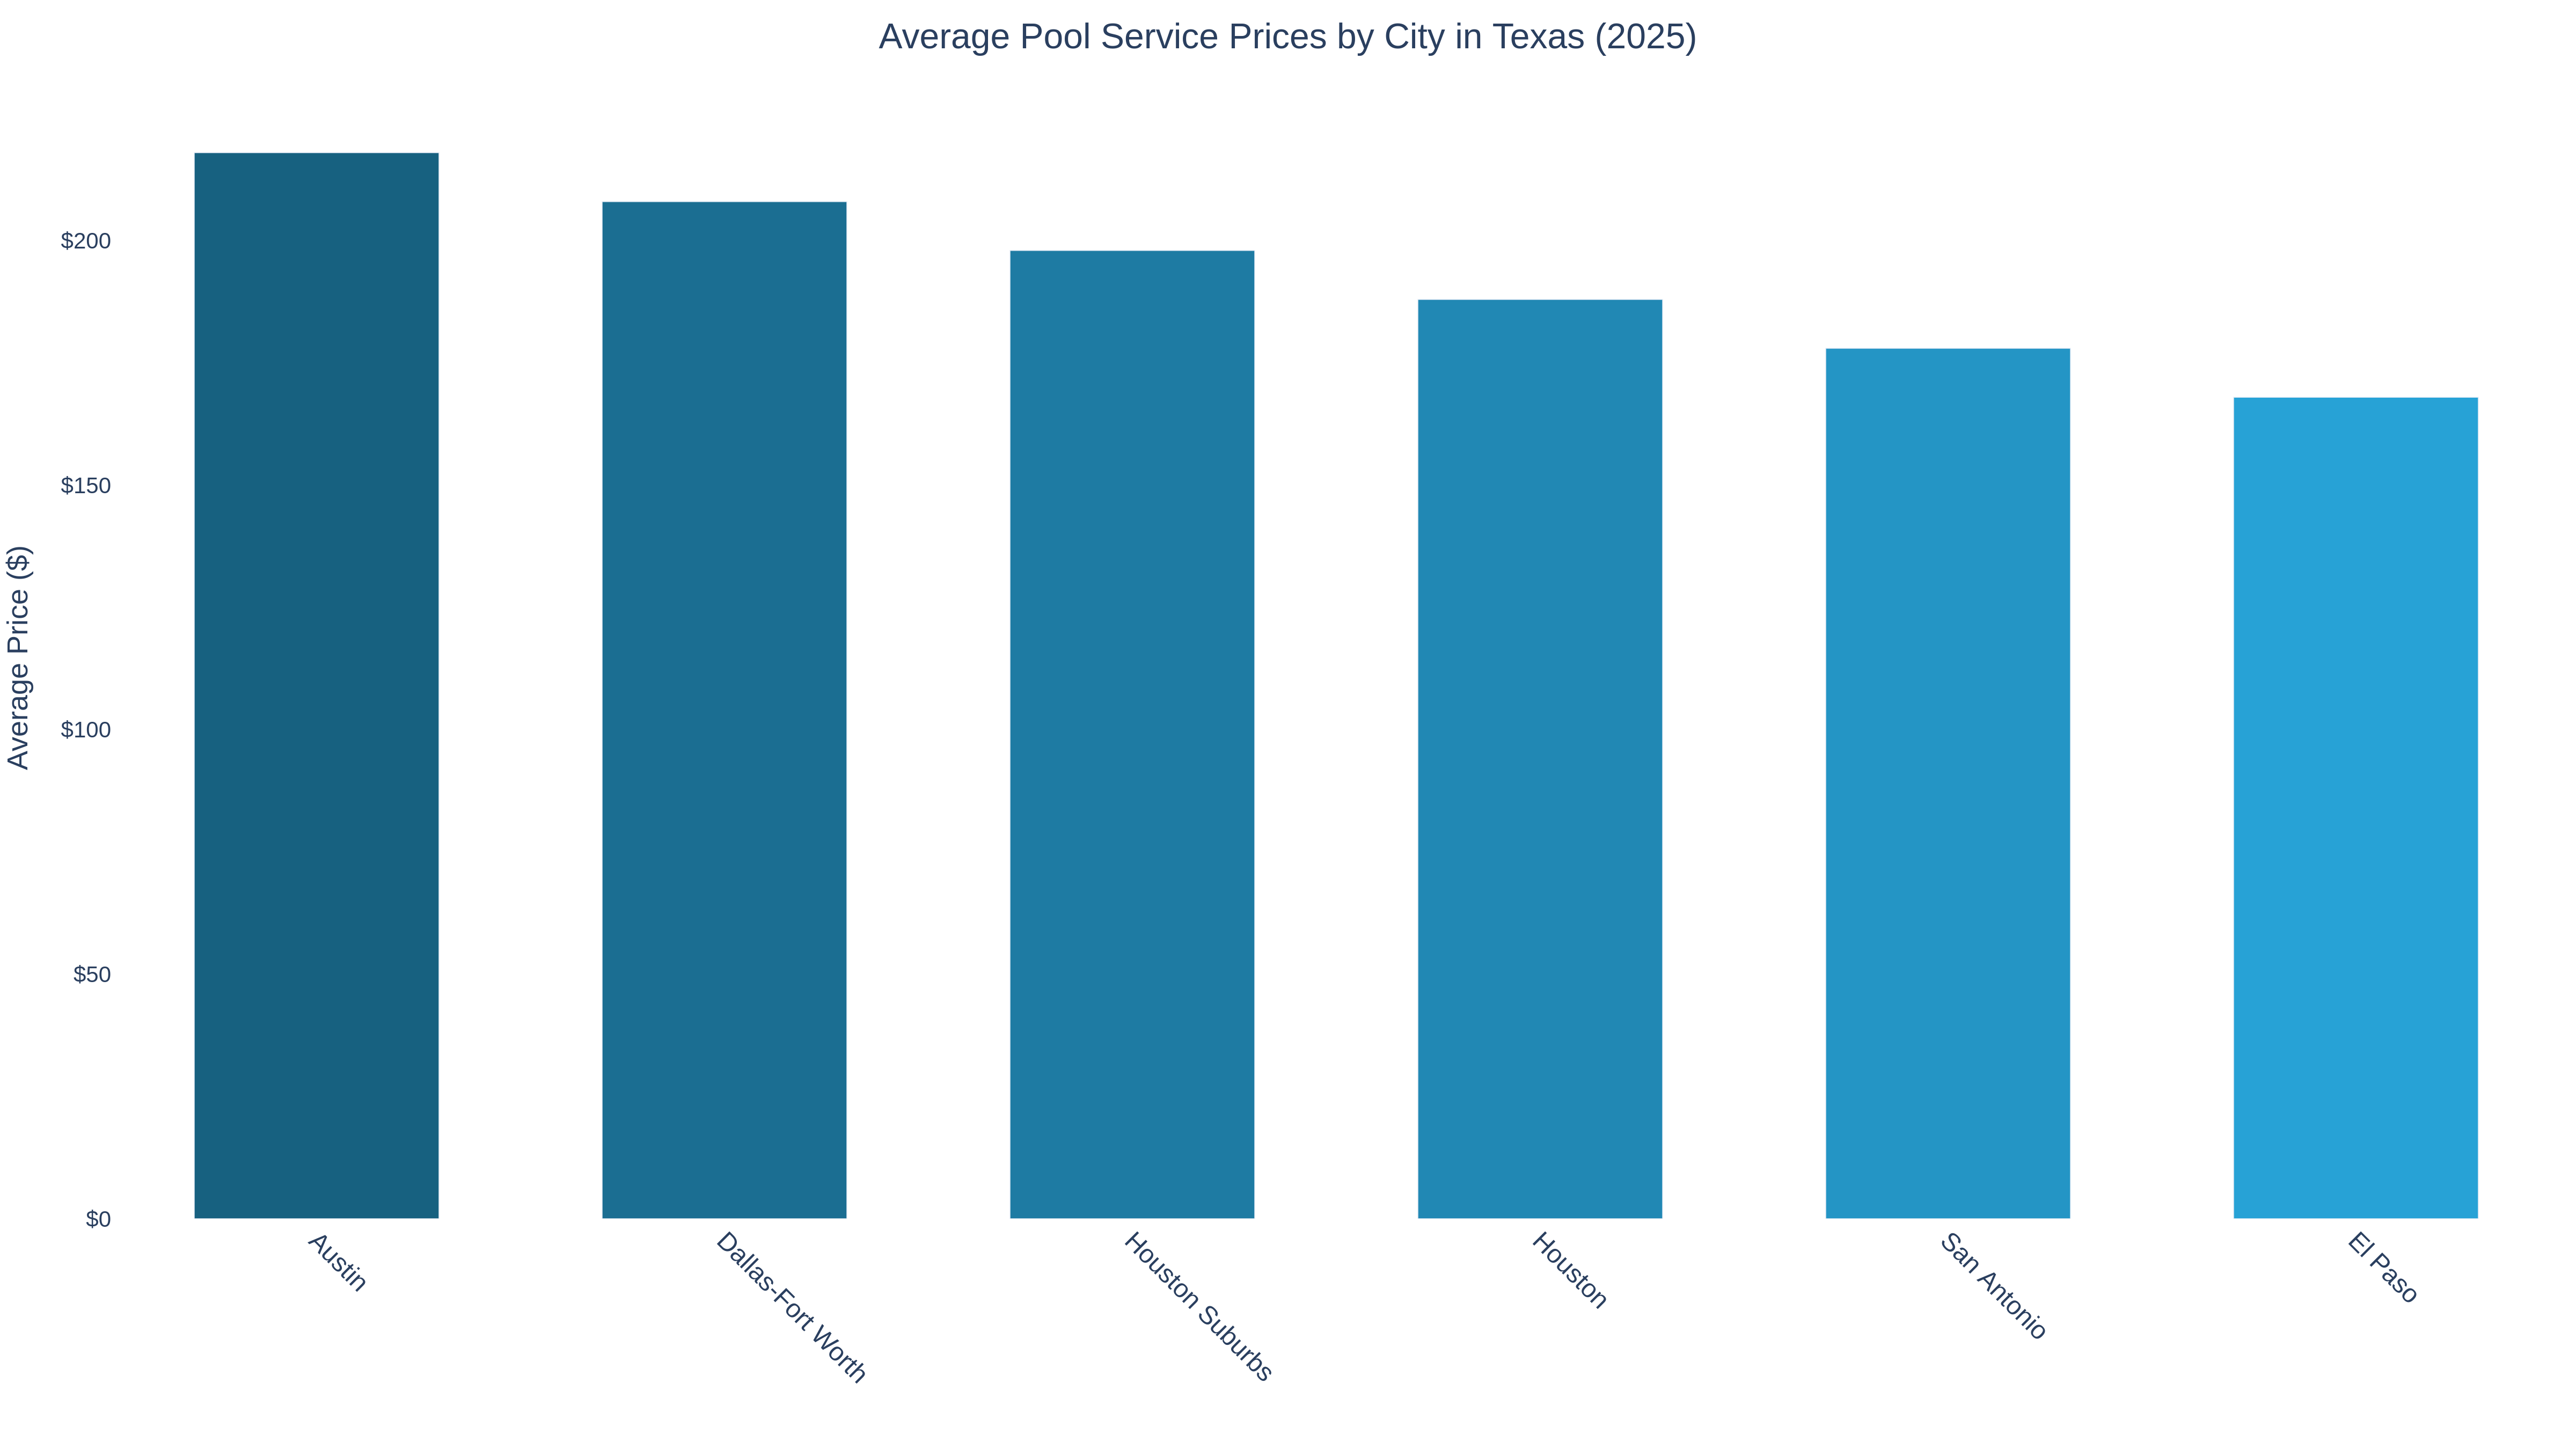
The Dallas-Fort Worth metroplex demonstrates this disparity clearly, with monthly services averaging $208 despite being a major metropolitan area. This suggests local competition and economic factors play significant roles in pricing beyond simple urban versus rural dynamics.
Pool equipment installations show similar patterns. Heater installations range from $3,506 in El Paso to $4,548 in Austin, reflecting both labor cost differences and varying demand for extended swimming seasons across Texas’s diverse climate zones.
Florida’s Consistent Pricing Defies Expectations
Despite being America’s pool capital, Florida maintains relatively moderate pricing across its major markets. Monthly pool cleaning averages $143 statewide, with premium markets like Naples/Fort Myers reaching only $157 monthly.
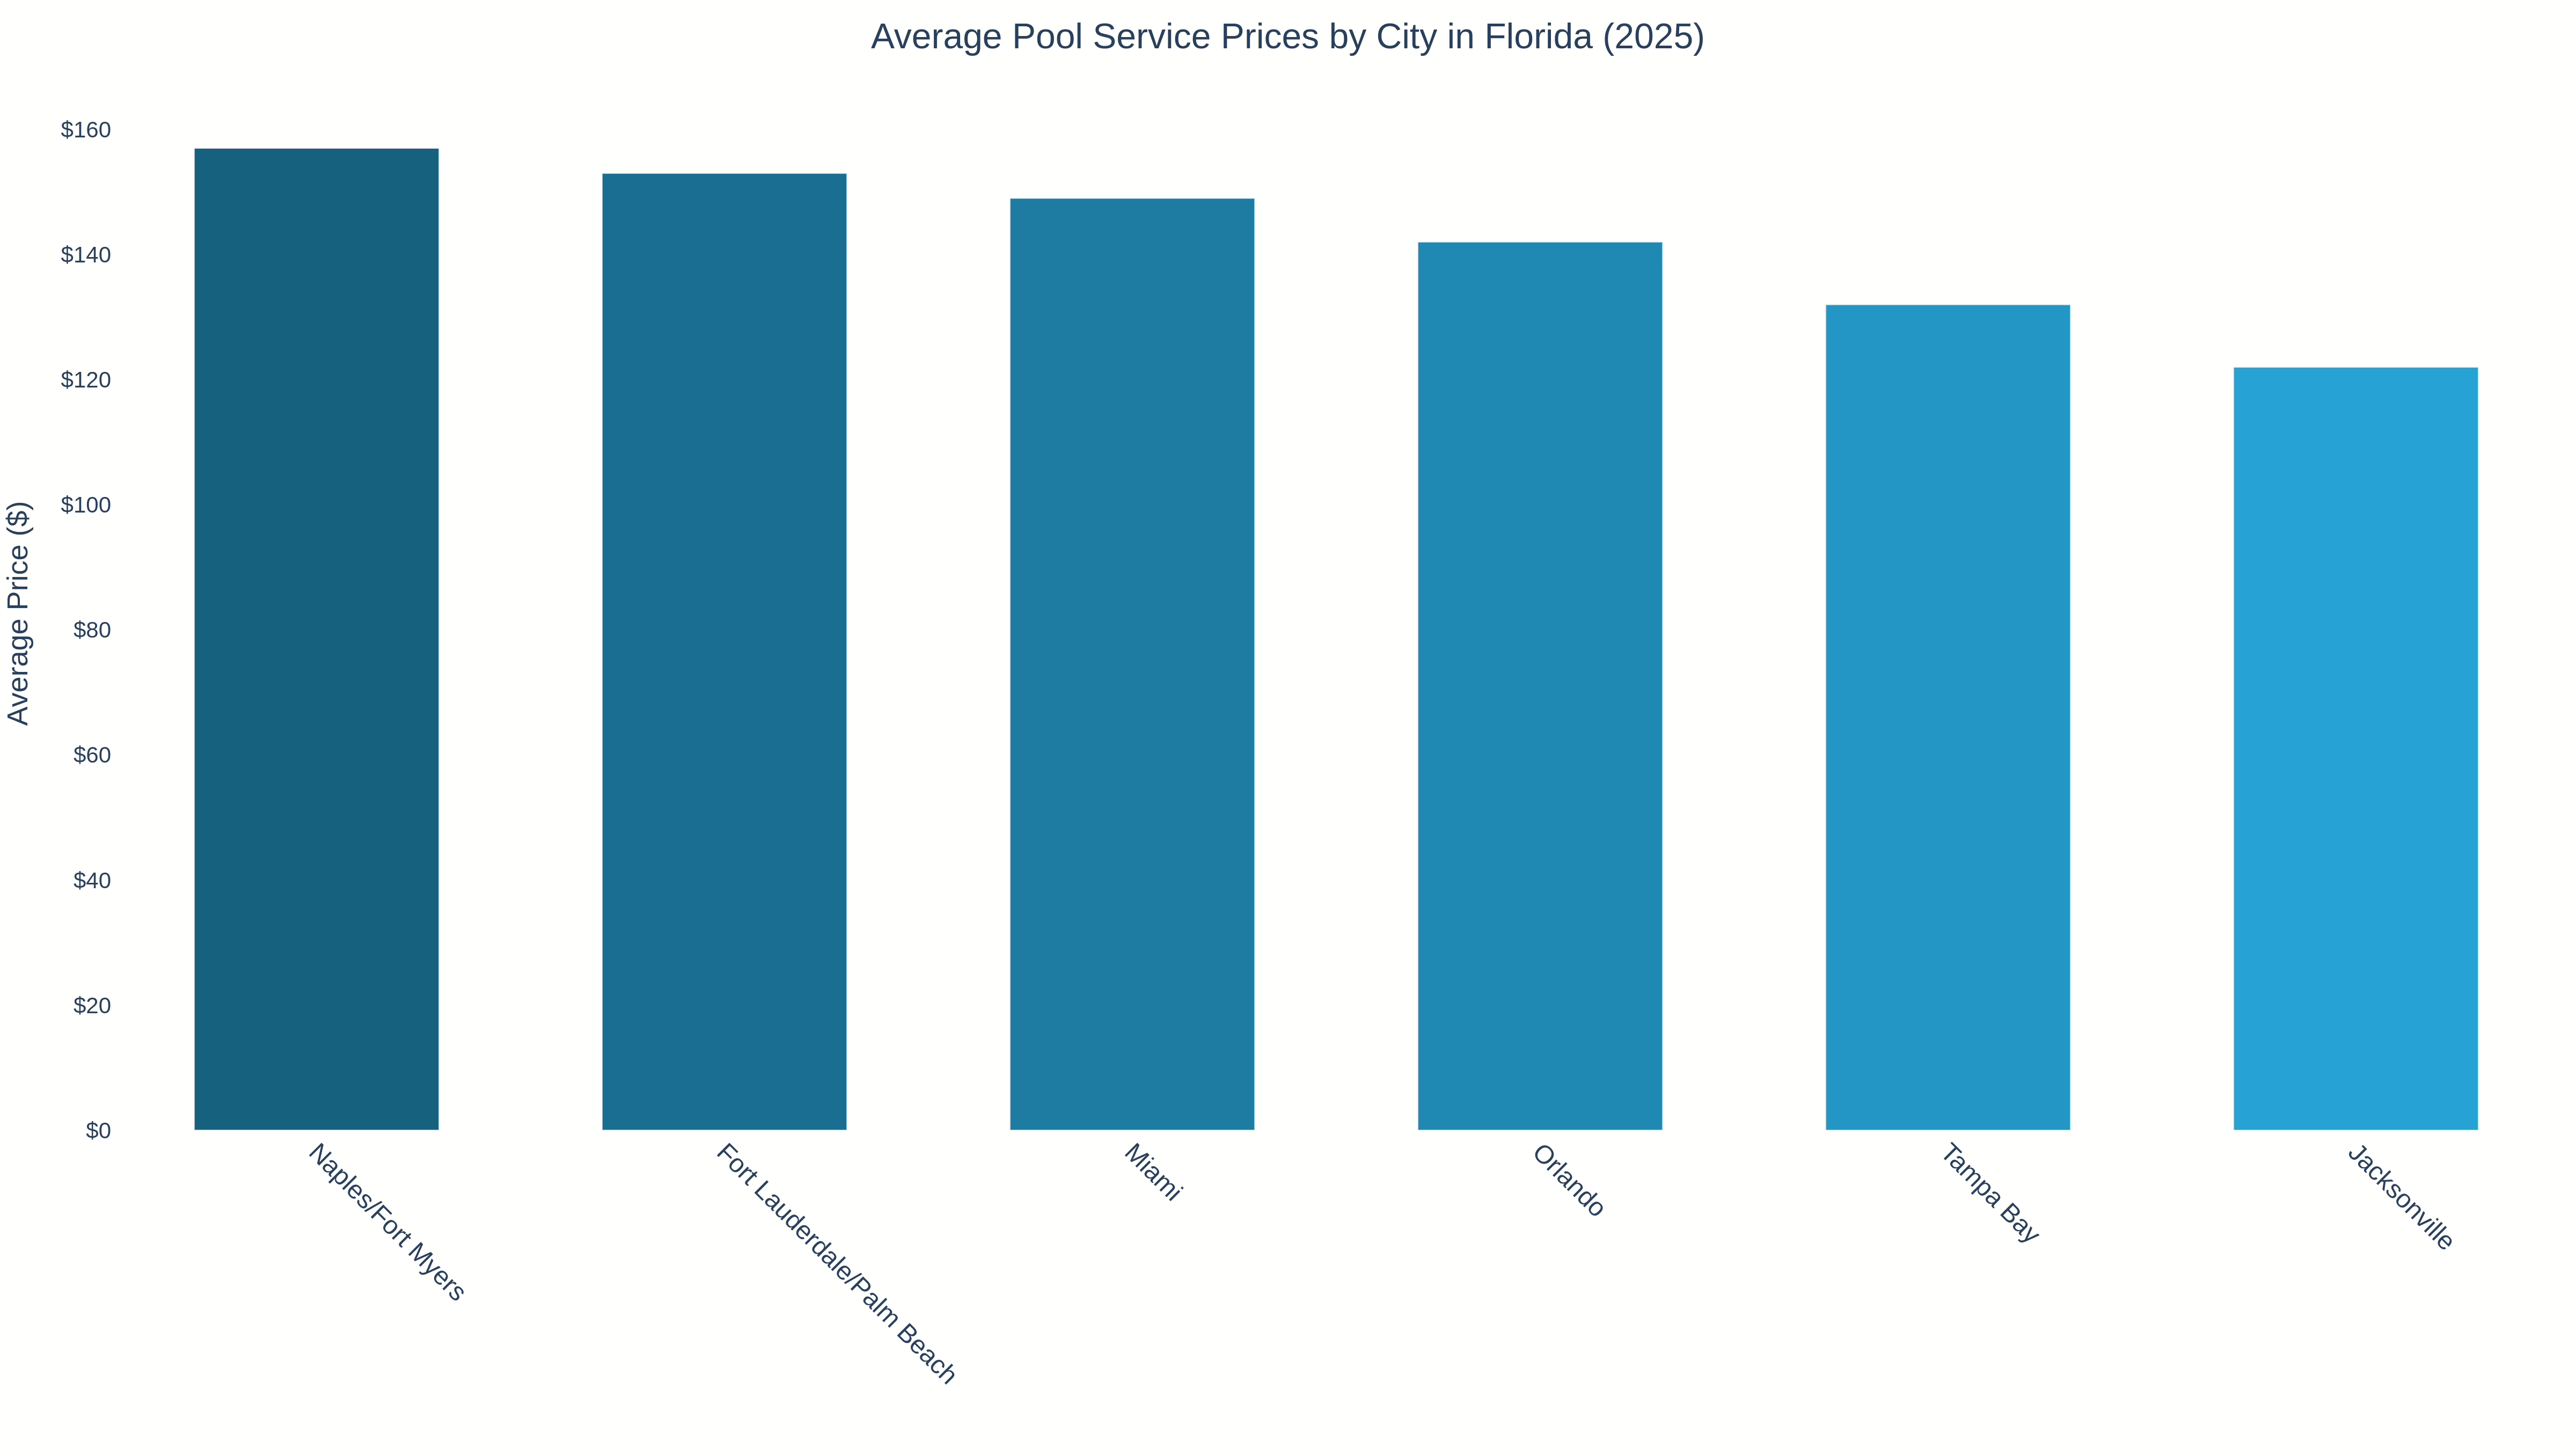
This consistency likely stems from Florida’s mature pool service industry and abundant workforce experienced in pool maintenance. The state’s year-round swimming season also supports steady demand that helps stabilize pricing.
However, Florida leads in specialized services. Miami hot tub cleaning reaches $230 monthly, suggesting luxury markets still command premium pricing for enhanced services.
Arizona and Nevada Reflect Desert Market Dynamics
Arizona and Nevada present interesting contrasts in desert pool maintenance. Arizona’s statewide average of $130 monthly masks significant local variations, with Scottsdale reaching $140 while Tucson remains at the state average.
Nevada shows more uniform pricing at $130 monthly statewide, though Las Vegas commands a slight premium at $140. Both states reflect the challenges of maintaining pools in extreme heat and low humidity, which require specialized chemical balancing and equipment monitoring.

Equipment Installation Costs Signal Broader Market Trends
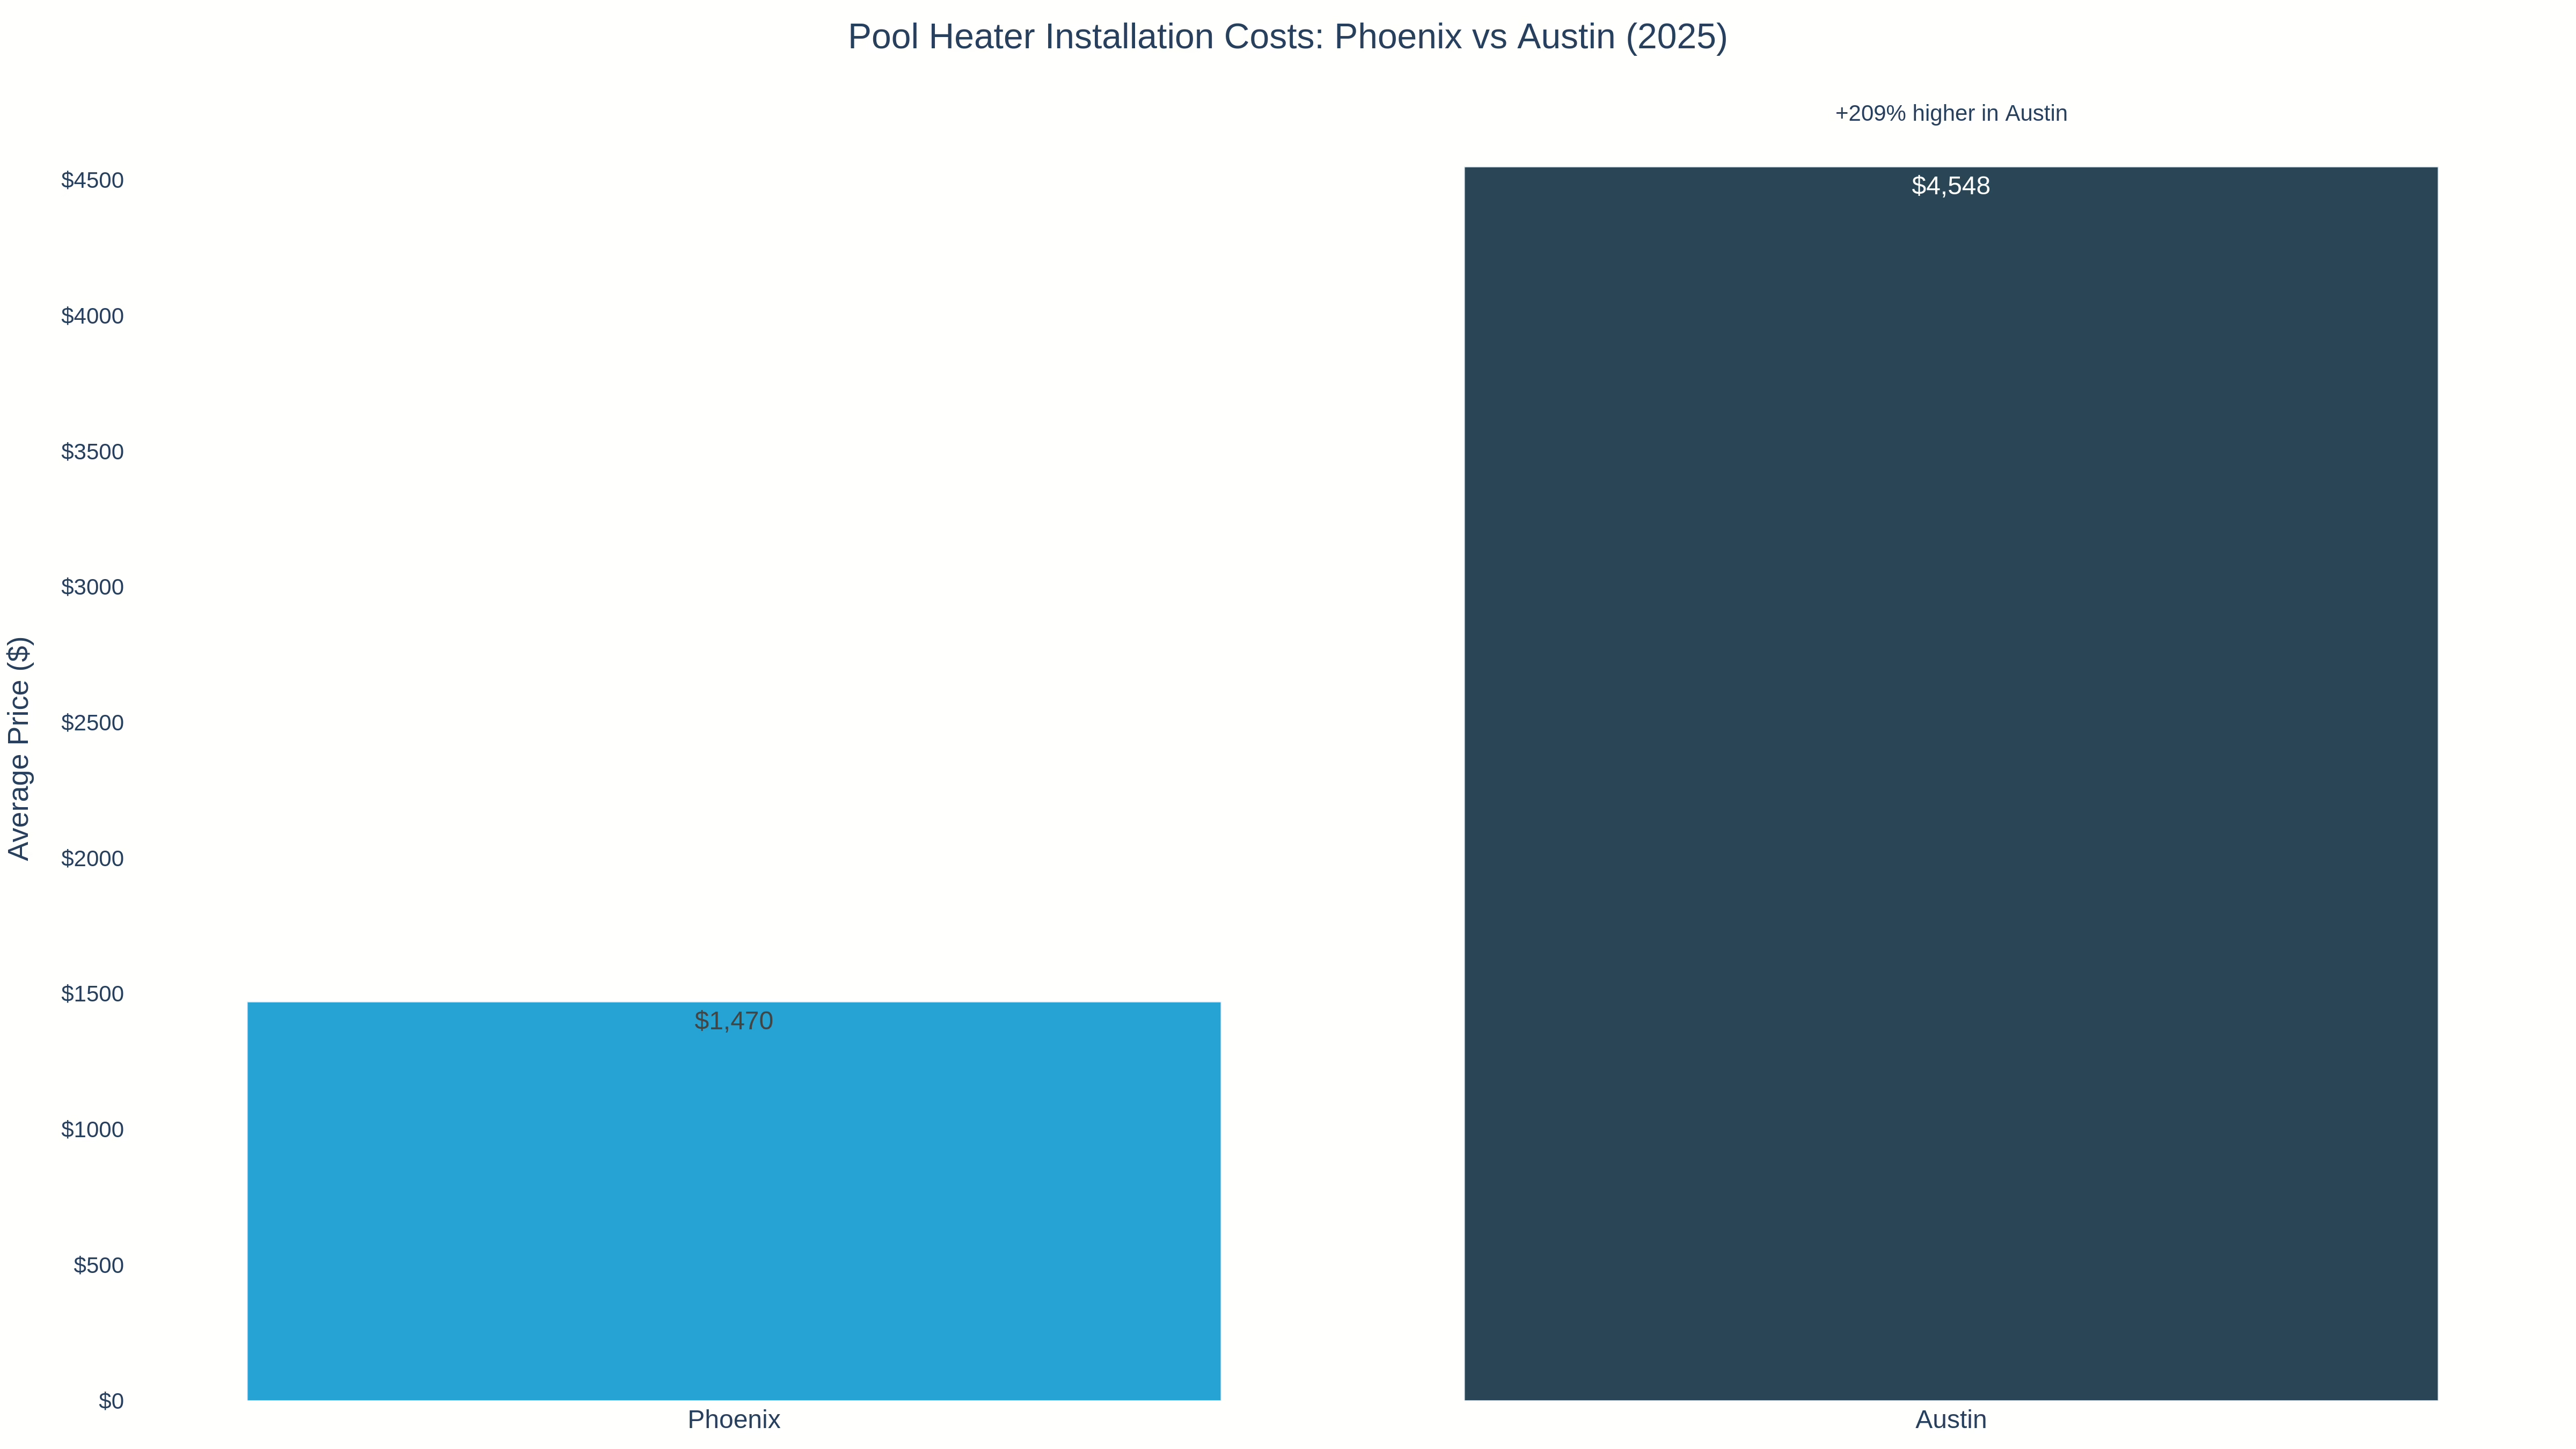
Beyond routine maintenance, equipment installation costs reveal underlying market pressures. Pool heater installations range from $1,470 in Phoenix to $4,548 in Austin, suggesting regional differences in both labor costs and equipment availability.
Filter installations show similar patterns, with California markets commanding $1,300 average costs compared to $900 to $1,000 in other states. These disparities likely reflect both higher labor costs and more stringent installation requirements in certain markets.
Economic Indicators Behind the Numbers
The pricing variations align with broader economic indicators affecting homeowner services. Markets with higher costs of living, tighter labor markets, and premium real estate values consistently show elevated pool service pricing. This suggests pool maintenance costs serve as a reliable indicator of local economic conditions.
Climate factors also play crucial roles. Markets requiring year-round pool maintenance or specialized equipment for extreme weather conditions command higher prices. Similarly, areas with water restrictions or environmental regulations see elevated costs for compliance-related services.
The 2025 Pool Service Pricing Guide broke pricing down across all 50 states and major metropolitan areas, giving homeowners, real estate professionals, and industry participants a market benchmark for the year.
Editor’s note: the full 50-state pricing guide is no longer published. The study findings summarized above are unchanged. For current pricing in the California regions Cabana serves, get a quote in about two minutes.